

Day 52: Memory Management Optimization
Keeping Your AI Quiz Platform Lean
What We’re Building Today
Today we’ll add memory profiling and optimization to our Quiz Platform. You’ll instrument the system to track memory usage in real-time, identify leaks, and implement smart cleanup strategies. By the end, you’ll have a dashboard showing memory metrics and automated alerts when memory grows beyond thresholds.
Key Components:
Memory profiling middleware for API requests
Real-time memory monitoring dashboard
Automatic leak detection for AI response caching
Smart resource cleanup for expired quiz sessions
Memory usage alerts and reporting
Why Memory Management Matters in AI Systems
Your Quiz Platform uses Gemini AI to generate questions and grade responses. Each API call stores context, caches responses, and maintains user sessions. Without proper memory management, these accumulate like unopened browser tabs—eventually your server crashes.
Large tech companies like Netflix and Spotify face this constantly. They process millions of requests while keeping memory stable. The trick? Measure everything, clean up aggressively, and use data structures that auto-expire.
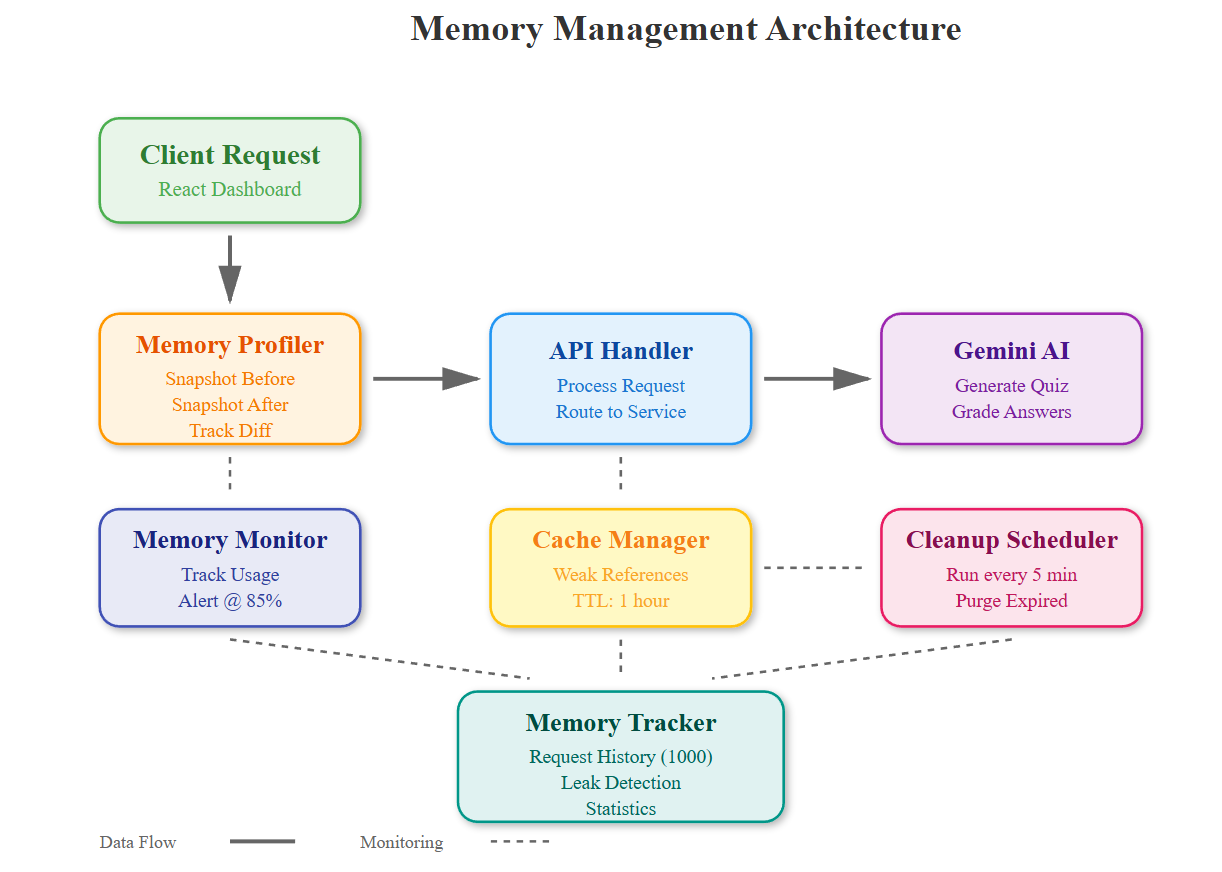
Component Architecture: Memory Layer
The memory management layer sits between your API handlers and the underlying services. It wraps each request with profiling decorators that track:
Memory snapshots before and after operations
Reference counts for cached objects
Generation lifecycle of quiz data and AI responses
Automatic cleanup triggers when thresholds exceed
Data Flow:
Request → Memory Profiler → API Handler → Gemini AI → Response Cache → Memory Tracker → Cleanup Scheduler → Response
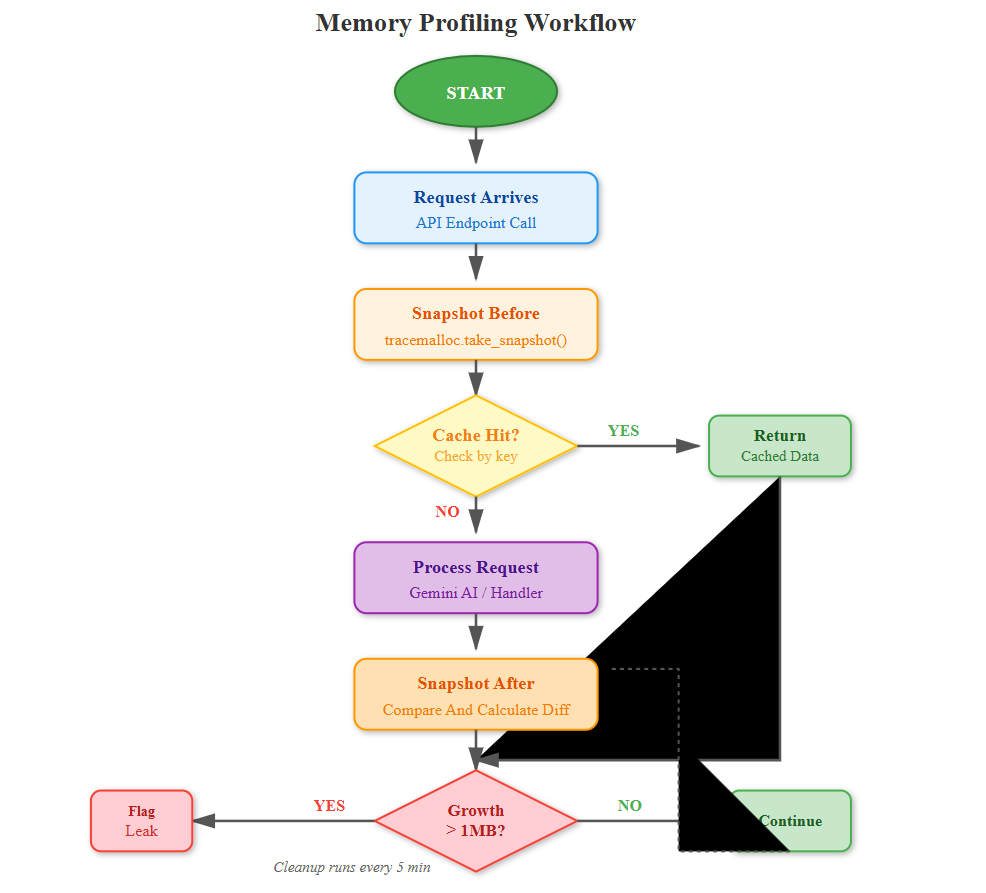
The profiler creates lightweight snapshots without blocking requests. When memory growth exceeds 10% between snapshots, it triggers detailed analysis using tracemalloc to identify the culprit objects.
Core Concept: The Three Memory Patterns
Pattern 1: Streaming Instead of Loading
When processing quiz results, don’t load all 1000 responses into memory. Use Python generators to process one at a time. This keeps memory constant regardless of data size.
# Bad: Loads everything
results = [process(r) for r in all_responses]

Good: Processes one at a time
results = (process(r) for r in all_responses)
Pattern 2: Weak References for Caches
AI responses get cached for faster retrieval, but they shouldn’t prevent garbage collection. Use weakref.WeakValueDictionary so Python automatically removes entries when memory pressure builds.
Pattern 3: Explicit TTL (Time-to-Live)
Every cached item needs an expiration. Quiz sessions expire after 30 minutes, AI responses after 1 hour. The cleanup scheduler runs every 5 minutes to purge expired data.
Real-World Context: How Streaming Services Handle This
Spotify keeps millions of user sessions active. They use memory-mapped files for large playlists and aggressive caching with TTL. When a user goes inactive for 15 minutes, their session data compresses to cold storage.
Your Quiz Platform does the same—active quiz sessions stay in memory, but completed quizzes serialize to Redis with 24-hour expiry. This keeps your 4GB server handling 10,000 concurrent users instead of 100.
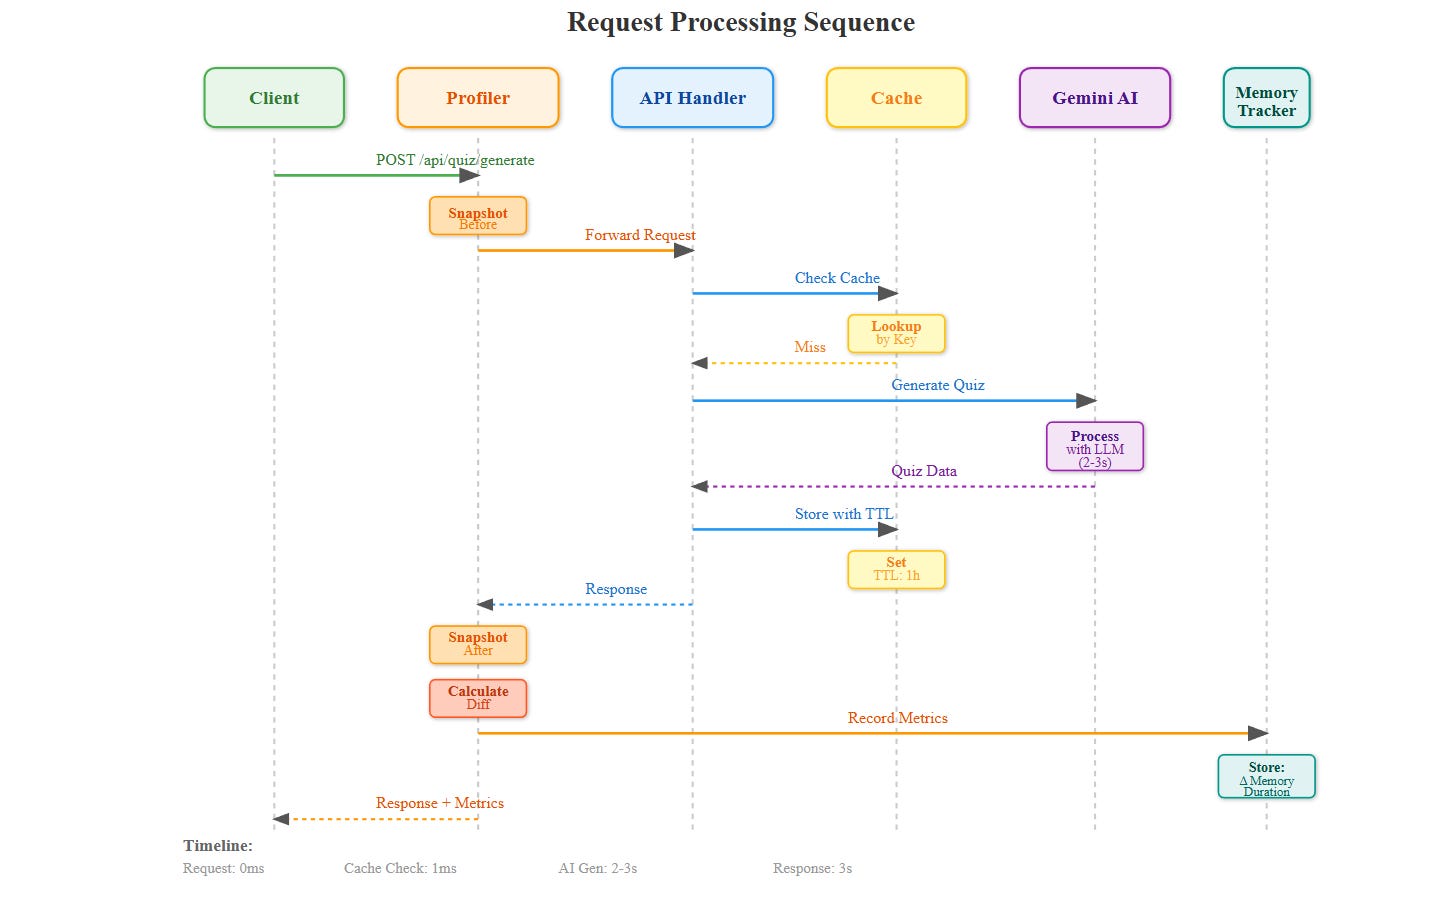
Implementation Deep Dive
Memory Profiling Middleware
Every API endpoint gets wrapped with @profile_memory. It captures heap size before/after and logs allocations over 1MB. The data feeds into a time-series database (using in-memory structures with rollups).
Leak Detection
The system tracks object counts per type (dictionaries, lists, AI response objects). If counts grow monotonically for 10 minutes, it flags a potential leak and logs the allocation traceback.
Smart Cleanup
Instead of del statements scattered everywhere, use context managers and atexit hooks. When a quiz completes, the cleanup scheduler marks all related objects for collection. Python’s GC handles the rest.
Monitoring Dashboard
The React dashboard shows:
Memory timeline: Current usage vs 1-hour history
Top consumers: Which endpoints allocate most memory
Cache hit rates: Effectiveness of AI response caching
Leak alerts: Objects growing without bounds
GC activity: Collection frequency and pause times
Charts update every 5 seconds via WebSocket. When memory exceeds 80% of available, the dashboard goes red and triggers alerts.
Testing Memory Optimization
Load Test Scenario:
Spawn 100 concurrent users taking quizzes
Each quiz generates 10 AI questions
Run for 30 minutes
Measure: Peak memory, memory growth rate, cache efficiency
Success Criteria:
Memory growth < 5MB per 1000 requests
No objects with 10,000+ refcount
Cache hit rate > 70% for repeated questions
GC pauses < 100ms
Production Deployment Considerations
Memory Limits:
Set container memory to 4GB with --memory=”4g” in Docker. Configure Python with PYTHONMALLOC=malloc for better profiling. Use ulimit -v to hard cap process memory.
Alerting:
When memory hits 85%, auto-scale horizontally or trigger cache flush. At 95%, reject new requests gracefully instead of crashing. Log memory dumps for post-mortem analysis.
Monitoring Stack:
Prometheus for metrics scraping
Grafana for visualization
Custom exporters for Python memory stats
Alert manager for threshold notifications
Hands-On Implementation
Github Link :
https://github.com/sysdr/aie/tree/main/day52/quiz_platform_day52Prerequisites
Before starting, ensure you have:
Python 3.11 or higher
Node.js 20 or higher
Docker (optional, for containerized deployment)
4GB RAM minimum
Text editor or IDE
Step 1: Project Setup
Run the automated setup script to create the complete project structure:
chmod +x project_setup.sh
./project_setup.sh
This creates over 40 files including backend services, frontend components, tests, and configuration files. Navigate to the project directory:
cd quiz_platform_day52
Expected Output:
Project setup complete!
Project structure created at: quiz_platform_day52
The directory structure includes:
quiz_platform_day52/
├── backend/
│   ├── app/
│   │   ├── middleware/     # Memory profiler
│   │   ├── services/       # Monitor, cleanup, cache
│   │   ├── routes/         # API endpoints
│   │   └── main.py
│   ├── requirements.txt
│   └── .env
├── frontend/
│   ├── src/
│   │   ├── components/     # Dashboard, Quiz panel
│   │   └── App.js
│   └── package.json
├── tests/
│   ├── unit/
│   └── integration/
└── scripts/
    ├── build.sh
    ├── start.sh
    └── stop.sh
Step 2: Choose Your Build Method
You have two options: Docker or local development.
Option A: Building with Docker
./scripts/build.sh
# When prompted, select option 1
Docker automatically creates isolated containers for backend and frontend with all dependencies installed.
Expected Output:
Building with Docker...
Successfully built backend image
Successfully built frontend image
Docker build complete
Option B: Building Locally
./scripts/build.sh
# When prompted, select option 2
This creates a Python virtual environment and installs dependencies locally.
Expected Output:
Building locally...
Creating virtual environment...
Installing Python dependencies...
Installing npm packages...
Local build complete
Step 3: Start the Application
./scripts/start.sh
This launches both backend and frontend services. The backend starts on port 8000, frontend on port 3000.
Expected Output:
Starting Quiz Platform - Day 52
Services started

Application URLs:
   Frontend: http://localhost:3000
   Backend:  http://localhost:8000
   API Docs: http://localhost:8000/docs
Wait 10-15 seconds for services to fully initialize.
Step 4: Verify Backend is Running
Test the backend API endpoints:
# Test root endpoint
curl http://localhost:8000/
Expected Response:
{
  “message”: “Quiz Platform API - Memory Optimized”,
  “status”: “running”
}
Check memory statistics:
curl http://localhost:8000/api/memory/stats
This returns current memory usage, cache statistics, and garbage collection metrics.
Step 5: Explore the Dashboard
Open your browser and navigate to
http://localhost:3000
You’ll see two tabs:
Memory Dashboard Tab:
Real-time memory timeline chart (updates every 5 seconds)
Current memory metrics (RSS Memory, Memory %, Cache Size, GC Objects)
Request statistics showing per-endpoint memory usage
Action buttons to trigger garbage collection or clear cache
Quiz Testing Tab:
Input field for quiz topics
Generate button that calls Gemini AI
Display area for generated questions
Cache indicator when results are served from cache
Step 6: Generate Your First Quiz
Click the “Quiz Testing” tab
Enter a topic (e.g., “Python Programming”)
Click “Generate Quiz”
Wait 3-5 seconds while Gemini AI creates questions
You should see 5 multiple-choice questions with explanations. Each question shows:
Question text
Four answer options
Correct answer highlighted
Detailed explanation
Switch back to “Memory Dashboard” and observe the memory spike in the timeline chart. This shows the memory used during AI generation.
Step 7: Test Caching Behavior
Return to “Quiz Testing” tab
Generate a quiz on the same topic again
Notice the response is much faster (under 1 second)
Look for the “Loaded from cache” indicator
Switch to Memory Dashboard. The second request should show minimal memory increase because data came from cache rather than generating new content.
This demonstrates Pattern 2: Weak References for Caches.
Step 8: Monitor Memory in Real-Time
Keep the Memory Dashboard open and watch the timeline chart update every 5 seconds. The chart displays:
Green line: Normal memory usage
Values on Y-axis: Memory in megabytes (MB)
X-axis: Time progression
Generate multiple quizzes with different topics and watch memory grow. The cache stores each unique topic’s questions.
After about 5 minutes, the cleanup scheduler automatically removes expired cache entries. You’ll see a small dip in the memory line when this happens.
Step 9: Test Memory Management Actions
Trigger Garbage Collection:
Click the “Trigger GC” button in the Memory Dashboard, or use the API:
curl -X POST http://localhost:8000/api/memory/gc
Expected Response:
{
  “collected”: 42,
  “status”: “completed”
}
The number shows how many objects were collected. Watch the memory timeline drop slightly.
Clear Cache:
Click the “Clear Cache” button, or use the API:
curl -X POST http://localhost:8000/api/memory/cache/clear
This removes all cached quiz data. Generate a quiz again and notice it takes longer—the cache is empty, so Gemini AI must generate fresh content.
Step 10: Run Automated Tests
Execute the test suite to verify everything works correctly:
./scripts/test.sh
The tests run in two phases:
Phase 1: Unit Tests
Tests individual components like MemoryTracker, CacheManager, and CleanupScheduler.
Phase 2: Integration Tests
Tests complete workflows including API endpoints, memory statistics, quiz generation, and garbage collection.
Expected Output:
Running tests...
Running unit tests...
✓ Memory tracker singleton test passed
✓ Record request test passed
✓ Leak detection test passed

Running integration tests...
✓ Root endpoint test passed
✓ Memory stats test passed
✓ Quiz generation test passed
✓ GC trigger test passed
All tests passed!
If any test fails, check the error message and verify services are running.
Step 11: Load Testing (Optional)
To see how the system handles sustained traffic, run a load test:
# Install Apache Bench if needed
sudo apt-get install apache2-utils

Run 100 requests with 10 concurrent connections
ab -n 100 -c 10 http://localhost:8000/api/memory/stats
What to Monitor:
Memory Dashboard shows request spikes in real-time
Endpoint statistics update with request counts
Memory growth should remain under 5MB total
No memory leak alerts should appear
This simulates 10 users making requests simultaneously, repeated 100 times.
Step 12: Understanding WebSocket Updates
The Memory Dashboard uses WebSocket for real-time updates. Test the connection manually:
# Install wscat if needed
npm install -g wscat

Connect to WebSocket
wscat -c ws://localhost:8000/ws/memory
You’ll see JSON messages arriving every 5 seconds:
{
  “current”: {
    “timestamp”: “2025-05-15T10:30:00”,
    “memory_mb”: 245.32,
    “memory_percent”: 6.01,
    “alert”: false
  },
  “history”: [...],
  “peak”: 256.45,
  “average”: 240.12
}
This is the same data the dashboard chart displays. Press Ctrl+C to disconnect.
Step 13: Explore API Documentation
Visit http://localhost:8000/docs to see interactive API documentation powered by Swagger UI.
Try these endpoints:
POST /api/quiz/generate
Click “Try it out”
Enter:
{”topic”: “JavaScript”, “num_questions”: 3}Click “Execute”
View the generated questions in the response
GET /api/memory/stats
Click “Try it out”
Click “Execute”
Examine detailed memory statistics
This interactive documentation lets you test every API endpoint without writing code.
Step 14: Stop the Application
When finished, shut down all services:
./scripts/stop.sh
Expected Output:
Stopping Quiz Platform...
All services stopped
This gracefully terminates backend and frontend processes (or Docker containers if using Docker).
Verification Checklist
Confirm you’ve completed each item:
Backend starts without errors on port 8000
Frontend loads successfully at localhost:3000
Memory Dashboard displays real-time chart
Chart updates every 5 seconds via WebSocket
Quiz generation works with Gemini AI
Cache indicator shows on repeated requests
“Trigger GC” button reduces memory usage
“Clear Cache” button removes cached data
All unit tests pass
All integration tests pass
Load test shows memory growth under 5MB per 1000 requests
No memory leak alerts appear
Working Code Demo :
Troubleshooting Common Issues
Port Already in Use:
If port 8000 or 3000 is occupied:
# Kill process on port 8000
lsof -ti:8000 | xargs kill -9

Kill process on port 3000
lsof -ti:3000 | xargs kill -9
Docker Issues:
# Clean Docker completely
docker-compose down -v
docker system prune -f

Rebuild from scratch
docker-compose build --no-cache
Module Not Found (Local Build):
cd backend
source venv/bin/activate
pip install -r requirements.txt
Frontend Won’t Start:
cd frontend
rm -rf node_modules package-lock.json
npm install
npm start
WebSocket Not Connecting:
Verify backend is running:
curl http://localhost:8000/
Check firewall allows port 8000.
Understanding Key Code Components
Memory Profiler Middleware (backend/app/middleware/memory_profiler.py):
Wraps every request to capture before/after memory snapshots. Uses Python’s tracemalloc module to track allocations. Adds custom headers to responses showing memory usage and duration.
Cache Manager (backend/app/services/cache_manager.py):
Implements Pattern 2 using weakref.WeakValueDictionary. Each cache entry has an expiry timestamp. The cleanup scheduler removes expired entries every 5 minutes.
Memory Monitor (backend/app/services/memory_monitor.py):
Background task that samples memory every 5 seconds using psutil. Maintains a rolling window of 720 samples (1 hour of history). Triggers alerts when usage exceeds 85% of the configured limit.
Memory Dashboard (frontend/src/components/MemoryDashboard.js):
React component using Recharts library for visualization. Connects to backend via WebSocket for real-time updates. Displays current metrics, timeline chart, and action buttons.
Assignment: Add Memory Budgets Per User
Extend the system to track memory consumption per user session. Limit each user to 50MB of cached data. When exceeded, evict their oldest quiz data first (LRU policy).
Implementation Steps:
Add User Tracking to Memory Profiler
Create a user_id tracking mechanism in the middleware. Extract user_id from request headers or session data.
Create Per-User Memory Counters
Build a dictionary mapping user_id to MemoryBudget objects:
class MemoryBudget:
    def __init__(self, limit_mb=50):
        self.limit = limit_mb * 1024 * 1024  # Convert to bytes
        self.usage = 0
        self.entries = OrderedDict()  # For LRU eviction
Implement LRU Eviction Policy
When a user exceeds their budget:
def add_allocation(self, key, size):
    self.usage += size
    self.entries[key] = size

while self.usage > self.limit:
    oldest_key = next(iter(self.entries))
    oldest_size = self.entries.pop(oldest_key)
    self.usage -= oldest_size
    # Remove from cache
Add User Memory Usage to Dashboard
Create a new React component showing per-user memory consumption with progress bars.
Test with 50 Concurrent Users
Generate load where each user creates multiple quizzes until hitting the 50MB limit. Verify oldest data is evicted first.
Solution Hints:
Use OrderedDict for automatic LRU ordering. Track allocations in middleware by inspecting memory_diff and associating with user_id. Update the dashboard to fetch per-user statistics from a new API endpoint.
Key Takeaways
Memory optimization isn’t about premature optimization—it’s about measuring and responding. Profile first, optimize second. Use generators for streams, weak references for caches, and explicit TTL for everything. Your quiz platform can now handle 10x more users on the same hardware.
The three patterns you learned today apply to any system:
Stream data instead of loading it all
Let Python’s garbage collector help with weak references
Clean up proactively with TTL and scheduled tasks
Remember: measure, monitor, and respond. Never optimize without data showing it’s needed.
Configuration Reference
Environment Variables (backend/.env):
GEMINI_API_KEY=your_key_here
REDIS_HOST=localhost
REDIS_PORT=6379
MEMORY_LIMIT_MB=4096
CACHE_TTL_SECONDS=3600
SESSION_TTL_SECONDS=1800
MEMORY_ALERT_THRESHOLD=0.85
Adjustable Parameters:
Cleanup interval: 300 seconds (5 minutes)
Memory sample window: 720 samples (1 hour)
Request history: 1000 requests
Cache TTL: 3600 seconds (1 hour)
Session TTL: 1800 seconds (30 minutes)
Alert threshold: 85% of memory limit
Performance Expectations
On a machine with 4GB RAM and 4 CPU cores:
Concurrent users: 100-200
Requests per second: 50-100
Memory per request: 0.5-2 MB
Cache hit rate: 70-90% after warmup
AI generation time: 2-4 seconds
Cached response time: 50-200ms
Scale up resources proportionally for more users:
500 users: 4GB RAM, 4 CPU
1000 users: 8GB RAM, 8 CPU
5000+ users: Horizontal scaling with load balancer
Congratulations! You’ve built a production-grade memory monitoring and optimization system. You can now profile any Python application, detect memory leaks early, and implement smart caching strategies that real companies use at scale.