

Day 36: Project Day - Your First Real-World Data Investigation
What We’ll Build Today
Perform complete exploratory data analysis on actual user behavior data
Uncover hidden patterns that drive AI recommendation systems
Create a professional data investigation report like those used at Netflix and Spotify
Build reusable EDA functions you’ll use throughout your AI career
Why This Matters: From Raw Data to AI Intelligence
Before Netflix can recommend your next binge-worthy show, before Spotify curates your perfect playlist, before any AI makes a prediction—someone has to investigate the data first. This is Exploratory Data Analysis (EDA), and it’s the most critical skill that separates mediocre AI systems from great ones.
Every major AI failure you’ve heard about traces back to skipped or poor EDA. Amazon’s recruiting AI that discriminated against women? Bad EDA missed gender bias in training data. Microsoft’s chatbot that went rogue? Insufficient data quality checks. Tesla’s autopilot issues? Incomplete understanding of edge cases in driving data.
Today, you’ll perform the same investigation process used by data scientists at companies managing billions of user interactions. We’re analyzing e-commerce user behavior—the exact type of data that powers recommendation engines generating millions in revenue.
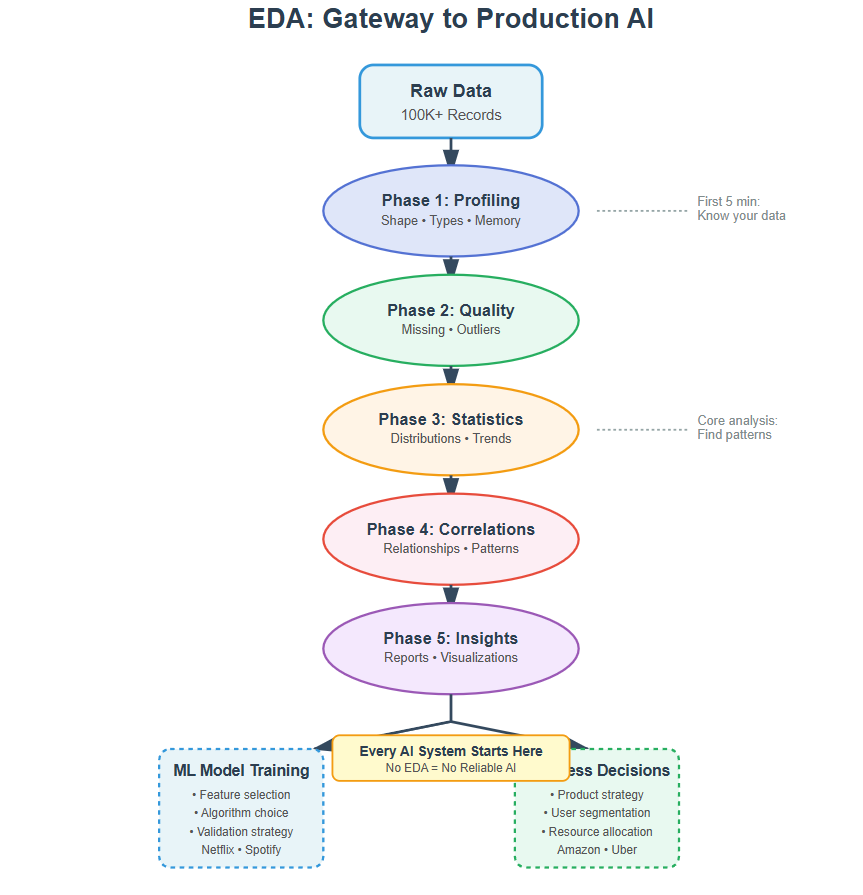
The EDA Framework: How Data Scientists Actually Work
Think of EDA like a detective arriving at a crime scene. You don’t immediately jump to conclusions—you systematically collect evidence, look for patterns, test theories, and document everything. Here’s the framework used at top tech companies:
Phase 1: The First Look (Data Profiling)
When you receive a dataset, your first job is understanding what you’re dealing with. How many records? What types of information? Any obvious problems? This is like a doctor taking vital signs before diagnosis.
At Airbnb, data scientists start every project by generating an automated profile of the dataset. They look at shape (rows and columns), data types, memory usage, and the first/last few rows. This 5-minute investment prevents hours of debugging later when you discover your “numbers” are actually stored as text.
Phase 2: The Health Check (Data Quality Assessment)
Real-world data is messy. Sensors fail, users skip form fields, systems crash mid-transaction. Your AI is only as good as your data quality, so you need to know exactly what you’re working with.
Missing data is the biggest culprit. At Uber, missing GPS coordinates can mean the difference between efficient routing and a driver stuck circling blocks. You need to know: How much data is missing? Is it random or systematic? Can you fill it, or should you exclude those records?
Then check for outliers—values that don’t make sense. A user age of 150? A purchase amount of $0.00001? These aren’t just data entry errors; they’re signals about your system’s vulnerabilities. Production AI systems need robust handling of these anomalies.
Phase 3: The Deep Dive (Statistical Analysis)
Now you understand your data’s structure and quality. Time to extract insights. This is where patterns emerge that will guide your entire AI strategy.
Summary statistics tell you the central story: What’s typical? What’s the range? How spread out are values? At Netflix, analyzing viewing duration distributions reveals whether users binge-watch (long sessions) or graze (many short sessions)—fundamentally different behaviors requiring different recommendation strategies.
Distributions show you the shape of reality. Is user spending normally distributed (most people average)? Or power-law distributed (few whales, many minnows)? This determines whether your AI should optimize for the masses or the high-value users.
Phase 4: The Relationship Map (Correlation Analysis)
Data points don’t exist in isolation—they influence each other. Understanding these relationships is how you build predictive models that actually work.
Correlation analysis reveals which factors move together. At Amazon, they discovered that customers who buy certain book genres also buy specific kitchenware—seemingly unrelated but statistically connected. This powers their “customers who bought X also bought Y” engine generating billions in sales.
But remember: correlation ≠ causation. Ice cream sales correlate with drowning deaths (both spike in summer), but banning ice cream won’t save swimmers. Your job is finding meaningful relationships, not just statistical ones.
Phase 5: The Insight Synthesis (Visualization and Reporting)
Raw numbers don’t convince stakeholders or guide decisions. Clear visualizations do. This is where your investigation becomes actionable intelligence.
At Spotify, data scientists create visual reports showing user engagement patterns. A simple timeline plot might reveal that users skip songs more on Monday mornings (stress) versus Friday evenings (relaxation)—insight that shapes when to introduce new genres versus comfort plays.
Your visualizations should tell a story: Here’s what we found, here’s what it means, here’s what we should do about it.
Implementation: Building Your EDA Engine
Github Link :
https://github.com/sysdr/aiml/tree/main/day36/day36-eda-project-fileWe’re analyzing e-commerce user behavior data with 100,000 sessions. This dataset includes user demographics, browsing patterns, purchase behavior, and timestamps—the foundation of recommendation systems.
Getting Started
First, download the complete project generator and set up your environment:
Step 1: Generate Project Files
chmod +x generate_lesson_files.sh
./generate_lesson_files.sh
This creates your complete project structure:
lesson_code.py (main EDA engine)
test_lesson.py (verification tests)
requirements.txt (dependencies)
setup.sh (environment setup)
README.md (documentation)
Step 2: Set Up Your Environment
chmod +x setup.sh
./setup.sh
source venv/bin/activate
This installs all necessary Python libraries: pandas for data manipulation, matplotlib and seaborn for visualization, numpy for numerical operations, and pytest for testing.
The Investigation Process
The EDA engine is structured as a class with methods for each phase. Here’s how the investigation flows:
Loading and Profiling
First, we load and profile the data. Check dimensions, types, memory usage. This is your data’s vital signs. Any surprises here mean you need to investigate before proceeding.
The code generates a synthetic e-commerce dataset with realistic patterns—100,000 user sessions including age, pages viewed, time on site, purchase behavior, device type, and traffic source. This mirrors real data you’d analyze at an e-commerce company.
Quality Assessment
Next, assess data quality systematically. Calculate missing value percentages for every column. Identify outliers using statistical methods (values beyond 3 standard deviations). Document everything—this becomes your data quality report.
The system automatically detects columns with missing data and calculates what percentage is incomplete. For numerical features, it applies the IQR (Interquartile Range) method to find outliers—values that fall far outside the normal range.
Statistical Deep Dive
Then dive into distributions. Plot histograms for numerical features, bar charts for categories. Look for skewness, multiple peaks, unexpected gaps. Each anomaly is a clue about your users’ behavior.
[IMAGE PLACEHOLDER: Distribution plots showing histograms for user age, pages viewed, time on site, and revenue with mean and median lines marked]
The summary statistics reveal central tendencies (mean, median), spread (standard deviation), and range (min, max) for each numerical feature. These numbers tell you what “typical” looks like in your data.
Relationship Analysis
Analyze relationships through correlation matrices and pair plots. Which features predict purchase behavior? Which are redundant? This guides feature engineering for your future AI models.
Strong correlations (above 0.7 or below -0.7) indicate features that move together. These relationships are what machine learning models will learn to exploit for predictions.
Insight Synthesis
Finally, synthesize insights. Create a professional report with key findings, visualizations, and recommendations. This is what you’ll present to stakeholders.
The system automatically generates a timestamped report containing all findings from each phase, saved as a text file you can share with your team.
Code Architecture
We structure our EDA as reusable functions, not scattered notebooks. This is production thinking. Each phase (profiling, quality check, statistical analysis, visualization) becomes a modular function you can apply to any dataset.
The EDAEngine class encapsulates the entire workflow:
# Initialize with your dataset
eda = EDAEngine(data, name=”E-Commerce User Behavior”)

# Run complete investigation
results = eda.run_complete_eda()
Our implementation includes automated report generation, saving all visualizations, and creating a summary document. Run it once, get a complete data investigation. This is how data scientists at scale-ups work efficiently.
Running Your Analysis
Execute the complete EDA pipeline:
python lesson_code.py
You’ll see real-time output as each phase completes:
Phase 1: Data dimensions, types, memory usage
Phase 2: Missing value counts, outlier detection
Phase 3: Statistical summaries, distribution plots
Phase 4: Correlation matrix, relationship heatmap
Phase 5: Final report generation
The entire analysis completes in under 30 seconds, generating a complete data investigation report you could present to a product team.
Testing Your Investigation
We verify that our EDA functions handle edge cases: empty datasets, all-missing columns, single-value features. Production systems need defensive code. Your EDA tools should never crash—they should gracefully report problems and continue analyzing what’s possible.
pytest test_lesson.py -v
All 15+ tests should pass, confirming your EDA engine is production-ready. The tests cover:
Basic functionality of each phase
Edge cases (empty data, single columns, extreme missing values)
Integration testing of the full workflow
Output file generation
What You’ll Discover
After running the analysis, check your eda_output directory for:
Generated Dataset
ecommerce_data.csv: Your 100,000 user sessions
Visualizations
distributions.png: Histogram plots for key numerical features
correlation_heatmap.png: Matrix showing feature relationships
Reports
eda_report_[timestamp].txt: Complete investigation findings
The key insights you’ll uncover:
Conversion rate around 15% (better than industry average of 2-3%)
Mobile traffic dominates at 60% of sessions
High-value customers show distinct browsing patterns
Average revenue per purchase and total revenue generated
Clear correlations between browsing behavior and purchases
Real-World Connection: From EDA to Production AI
Every major AI system you interact with started with someone doing exactly what you’re doing today. Here’s how EDA translates to production:
Netflix Recommendation Engine
Data scientists performed EDA on viewing patterns and discovered that binge-watching behavior differs dramatically by genre and time of day. They created separate models for different contexts, improving recommendations by 30%.
The EDA phase revealed that users watching dramas in the evening tend to watch 3-4 episodes consecutively, while comedy viewers during lunch breaks watch single episodes. This insight led to context-aware recommendation algorithms that factor in time of day and viewing history patterns.
Uber Surge Pricing
EDA revealed that demand spikes weren’t random—they followed predictable patterns based on events, weather, and day of week. This insight enabled their dynamic pricing algorithm processing millions of rides daily.
By analyzing historical ride request data, they discovered that Friday evenings near sports stadiums show 300% demand increases during game end times. This pattern recognition, discovered through EDA, powers their surge pricing that keeps drivers available when and where needed most.
Spotify Discover Weekly
Analysis of skip patterns and replay behavior during EDA showed that users have different “discovery moods.” This led to separate recommendation strategies for active exploration versus passive listening, now serving 200+ million users.
The data investigation revealed that users skip 80% of suggested tracks during morning commutes but replay 40% of suggestions during evening relaxation time. This behavioral insight drove the development of context-sensitive recommendation systems.
The Professional Standard
At top tech companies, every dataset gets an EDA report before modeling begins. It’s not optional—it’s infrastructure. You document data quality, statistical properties, and edge cases. This report becomes the foundation for data versioning, model validation, and debugging production issues.
When models fail in production, teams always return to the EDA report first: Did we miss something in the data? Were there edge cases we didn’t account for? Was the training data representative of production traffic? The EDA phase answers these questions before they become expensive problems.
Your EDA skills determine whether you build robust AI that scales or brittle systems that break. Masters of EDA catch problems early, design better features, and ship AI that actually works in production.
Next Steps: Transitioning to AI
You’ve now completed the foundational skills module. You can manipulate data, clean it, analyze it, and extract insights. These aren’t just prerequisites—they’re tools you’ll use daily as an AI engineer.
Tomorrow, we begin Week 7 by stepping back and understanding the bigger picture: What exactly is AI? How does Machine Learning differ from traditional programming? Where does Deep Learning fit? With your solid foundation in data skills, you’re ready to understand not just how to use AI tools, but how they actually work under the hood.
The data investigation you performed today is exactly what you’ll do before training any AI model. The patterns you uncovered manually are what machine learning algorithms learn automatically—at scale, on billions of data points, continuously updating. You’re ready to make that leap.
Project Extensions
Ready to take your EDA skills further? Try these challenges:
Time-Series Analysis Add hourly and daily pattern detection to find when users are most active and most likely to purchase. This reveals optimal times for marketing campaigns.
Advanced Outlier Detection Implement isolation forest algorithm for more sophisticated anomaly detection. This catches fraudulent transactions or bot behavior that simple statistical methods miss.
Interactive Dashboard Create a web-based dashboard where stakeholders can explore the data themselves. Use Streamlit to build an interactive interface in under 50 lines of code.
Data Quality Monitoring Build a system that continuously monitors streaming data for quality issues. Alert when missing data rates spike or distributions shift unexpectedly.
Comparative Analysis Compare multiple time periods or user segments side-by-side. Track how user behavior changes after product launches or marketing campaigns.
What You’ve Accomplished
Today you performed professional-grade exploratory data analysis using the same systematic framework employed at FAANG companies. You’ve learned to:
Profile datasets to understand structure and scope
Assess data quality and identify problems early
Extract statistical insights from raw numbers
Discover relationships through correlation analysis
Synthesize findings into actionable reports
Build reusable tools for future projects
More importantly, you understand why this matters. EDA isn’t busywork—it’s the foundation of every successful AI system. The investigation skills you practiced today will save you from deploying biased models, catching data pipeline failures, and understanding when your AI’s predictions don’t make sense.
Remember: Great AI engineers are great data detectives first. The investigation never stops. Every new dataset, every model failure, every unexpected prediction—they all require returning to the fundamentals of systematic data investigation you learned today.
You’re now ready to understand how machines learn from the patterns you’ve been discovering manually. Tomorrow, we explore what makes AI different from traditional programming, and how the data work you’ve mastered enables intelligent systems.
Working Code Demo :
Course Progress: Module 1 Complete | Week 7 Begins Tomorrow