Day 19: Performance Analytics Engine - Turning Quiz Data Into Learning Insights
What We're Building Today
Today we're creating the brain that makes sense of all those quiz scores from yesterday's lesson. Here's what you'll have by the end:
High-Level Build Agenda:
Real-time analytics processing service that crunches quiz performance data
AI-powered insight generator using Gemini for personalized learning recommendations
Live dashboard with charts showing learning trends and patterns
WebSocket connections for instant updates as students take quizzes
Integration bridge connecting Day 18's scoring engine to Day 20's topic mapping
Think of it as building the "Netflix recommendation engine" but for learning - analyzing patterns, spotting knowledge gaps, and predicting where students need help next.
Why Performance Analytics Matter in AI Systems
Ever wondered how Khan Academy knows exactly which math concept you're struggling with? Or how Duolingo decides when to review vocabulary you learned weeks ago? That's performance analytics at work.
In production AI systems handling millions of learners, analytics engines are the difference between generic education and personalized learning experiences. They transform raw interaction data into intelligence that drives better outcomes.
Component Architecture Deep Dive
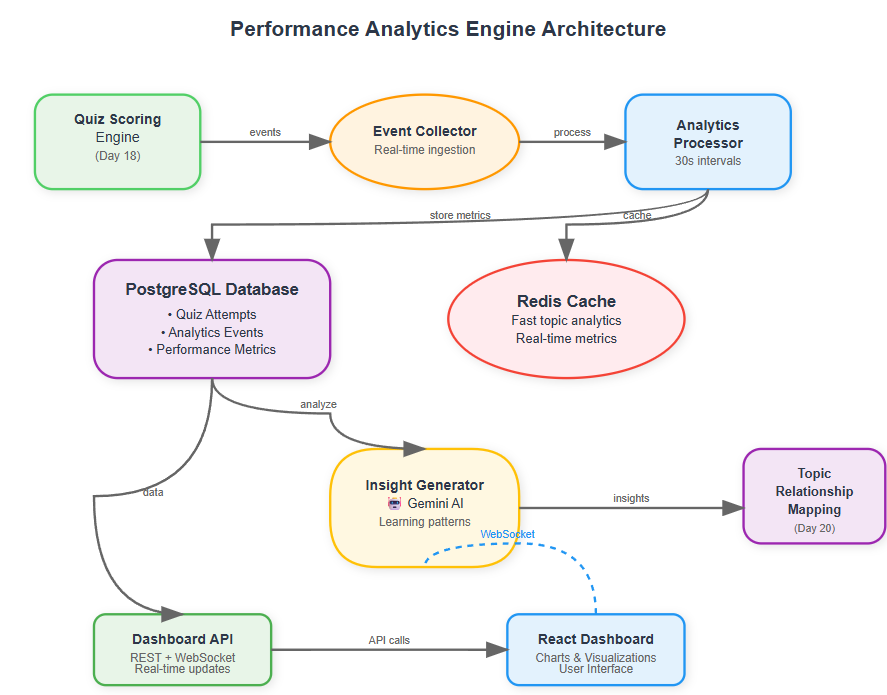
Our Performance Analytics Engine sits between the Quiz Scoring Engine (Day 18) and the upcoming Topic Relationship Mapping (Day 20). It's the analytical layer that processes scored quiz attempts and generates insights.
Core Components:
Event Collector: Captures quiz completion events in real-time
Analytics Processor: Aggregates performance data using time-window analysis
Insight Generator: Uses Gemini AI to identify learning patterns and recommend actions
Dashboard API: Serves processed analytics to the React frontend
Data Flow: Quiz attempts flow from the scoring engine → Event Collector → Analytics Processor → Insight Generator → Dashboard display. Each stage enriches the data with additional context and intelligence.
Real-World Impact
Companies like Coursera process over 10 million quiz attempts monthly. Their analytics engines track metrics like:
Time-to-mastery for different concepts
Common misconception patterns
Optimal review schedules
Predictive dropout indicators
Our implementation mirrors these production patterns but focuses on the core mechanics you can understand and extend.
State Management & Control Flow
The system operates in three distinct states:
Collection State: Buffering incoming quiz events
Processing State: Running aggregation jobs every 30 seconds
Serving State: Providing real-time insights via API
State transitions happen automatically based on data volume and time windows. The React dashboard subscribes to WebSocket updates for real-time performance visualization.
Key Insights for Engineers
For Backend Developers: Analytics systems require careful attention to data partitioning and aggregation windows. We use time-based bucketing to balance real-time insights with computational efficiency.
For Frontend Developers: Performance dashboards need progressive loading and caching strategies. Users expect sub-second response times even when processing millions of data points.
For System Architects: Analytics engines are write-heavy, read-optimized systems. Design for high ingestion rates but fast query responses using pre-computed aggregations.
For Product Managers: The value isn't in the data volume - it's in actionable insights. Focus metrics on decisions users can actually make based on the analytics.
Production Considerations
Real analytics systems handle scale challenges like:
Processing 100K+ events per second during peak learning hours
Maintaining sub-100ms query response times
Balancing storage costs with insight freshness
Handling partial failures gracefully
Our implementation demonstrates these patterns using Redis for fast aggregation and PostgreSQL for persistent storage.
Hands-On Implementation Guide
Github Link:
https://github.com/sysdr/aie/tree/main/day19/performance-analytics-engine
Quick Demo
git clone https://github.com/sysdr/aie.git
git checkout day19
cd aie/performance-analytics-engine
./start.sh
Open http://localhost:3000
./stop.sh
Prerequisites Setup
Environment Requirements:
bash
# Verify these versions
python3 --version # Should be 3.9+
node --version # Should be 18+
docker --version # Should be 20+
API Key Setup:
Get Gemini API key from Google AI Studio (https://makersuite.google.com/app/apikey)
Set environment variable:
export GEMINI_API_KEY="your_actual_api_key_here"
Phase 1: Backend Service Foundation
Step 1: Project Structure Create the organized directory structure with all necessary components:
performance-analytics-engine/
├── backend/
│ ├── app/
│ │ ├── models.py # Database schemas
│ │ ├── services/ # Analytics & AI services
│ │ ├── api/ # REST endpoints
│ │ └── utils/ # WebSocket manager
│ ├── requirements.txt
│ └── Dockerfile
├── frontend/
│ ├── src/
│ │ ├── components/ # React dashboard components
│ │ └── services/ # API & WebSocket clients
│ └── package.json
└── docker-compose.yml
Step 2: Database & Cache Setup
bash
# Start PostgreSQL and Redis containers
docker-compose up -d postgres redis
sleep 10 # Wait for services to initialize
# Verify database connection
docker exec -it performance-analytics-engine_postgres_1 psql -U postgres -d quiz_platform -c "SELECT version();"
Expected Output: PostgreSQL version information
Step 3: FastAPI Backend Launch
bash
cd backend
pip install -r requirements.txt
python -m uvicorn app.main:app --host 0.0.0.0 --port 8000 --reload
Verification Checkpoint:
API health check:
curl http://localhost:8000/health
Expected response:
{"status": "healthy", "service": "performance-analytics-engine"}
Interactive docs: http://localhost:8000/docs
Phase 2: React Dashboard Development
Step 4: Frontend Application
bash
cd frontend
npm install
npm start
Browser automatically opens to
http://localhost:3000
showing the analytics dashboard.
Dashboard Features Verification:
Metrics cards display correctly
Chart components render without errors
Navigation between pages works smoothly
Phase 3: Analytics Processing Engine
Step 5: Generate Test Analytics Events
bash
# Create realistic quiz completion events
curl -X POST "http://localhost:8000/api/v1/analytics/events" \
-H "Content-Type: application/json" \
-d '{
"event_type": "quiz_completed",
"user_id": "demo-student",
"quiz_id": "algebra-basics-001",
"topic_id": "mathematics",
"data": {
"score": 85,
"max_score": 100,
"time_spent": 420,
"answers": [{"question_id": "q1", "correct": true}]
}
}'
Expected Response: {"message": "Event created", "event_id": 1}
Step 6: Bulk Data Generation for Testing
bash
# Generate 50 sample events across different topics
for i in {1..50}; do
TOPICS=("mathematics" "science" "history" "literature" "programming")
TOPIC=${TOPICS[$((RANDOM % 5))]}
SCORE=$((60 + RANDOM % 40))
curl -s -X POST "http://localhost:8000/api/v1/analytics/events" \
-H "Content-Type: application/json" \
-d "{
\"event_type\": \"quiz_completed\",
\"user_id\": \"student-$i\",
\"quiz_id\": \"quiz-$i\",
\"topic_id\": \"$TOPIC\",
\"data\": {
\"score\": $SCORE,
\"max_score\": 100,
\"time_spent\": $((180 + RANDOM % 300))
}
}" > /dev/null
done
Phase 4: Real-Time Analytics Verification
Step 7: Dashboard Metrics Testing
bash
# Test the dashboard API endpoints
curl "http://localhost:8000/api/v1/analytics/dashboard?days=7"
Expected Output: JSON containing overview stats, daily activity data, and topic performance metrics
Step 8: User Performance Analytics
bash
# Get detailed user analytics
curl "http://localhost:8000/api/v1/analytics/user/demo-student/performance?days=30"
Expected Output: User performance summary with topic breakdown and learning trends
Step 9: AI Insights Generation
bash
# Generate AI-powered learning insights
curl "http://localhost:8000/api/v1/analytics/user/demo-student/insights"
Expected Output: Gemini AI-generated insights with confidence scores and action recommendations
Phase 5: WebSocket Real-Time Features
Step 10: Real-Time Connection Testing
bash
# Install WebSocket testing tool
npm install -g wscat
# Connect to WebSocket endpoint
wscat -c ws://localhost:8000/ws
Expected Behavior:
Connection established successfully
Real-time analytics updates received every 30 seconds
Dashboard auto-updates with new data
Phase 6: Frontend Dashboard Testing
Step 11: Dashboard Feature Verification
Navigate through each dashboard section:
Main Dashboard (
http://localhost:3000
):
Verify metrics cards show current data
Check line chart displays daily activity trends
Confirm bar chart shows topic performance
Watch for real-time update notifications
User Analytics (http://localhost:3000/user/demo-student):
Click "Generate Demo Data" if no data appears
Verify radar chart displays topic mastery
Check topic breakdown shows progress bars
Review AI insights cards with recommendations
Topic Analytics (http://localhost:3000/topic/mathematics):
Verify topic statistics display correctly
Check score distribution histogram
Review system-generated topic insights
Phase 7: Quality Assurance Testing
Step 12: Backend Unit Tests
bash
cd backend
python -m pytest app/tests/test_analytics.py -v
Expected Output: All tests passing with detailed results
Step 13: Frontend Component Tests
bash
cd frontend
npm test
Expected Output: React test suite passes without errors
Phase 8: Production Deployment
Step 14: Full Docker Deployment
bash
# Stop local development services
./stop.sh
# Build and deploy with Docker Compose
docker-compose up --build
Verification Points:
All services start without errors
Frontend accessible at
http://localhost:3000
Backend API responding at
http://localhost:8000
Database and Redis containers healthy
Phase 9: Performance & Load Testing
Step 15: System Load Testing
bash
# Generate high-volume event processing
for i in {1..200}; do
curl -s -X POST "http://localhost:8000/api/v1/analytics/events" \
-H "Content-Type: application/json" \
-d "{\"event_type\": \"quiz_completed\", \"user_id\": \"load-test-$i\", \"quiz_id\": \"quiz-$i\", \"topic_id\": \"performance-test\", \"data\": {\"score\": 80, \"max_score\": 100}}" &
done
wait
Step 16: Response Time Verification
bash
# Measure API response times
time curl "http://localhost:8000/api/v1/analytics/dashboard"
Performance Target: Response time under 500ms for dashboard queries
Success Criteria Checklist
Backend Service Verification
FastAPI server starts without errors
Database connections established successfully
All API endpoints respond with correct data
Analytics processing runs automatically every 30 seconds
WebSocket connections handle real-time updates
AI insights generate with valid Gemini integration
Frontend Dashboard Verification
React application loads and renders correctly
Dashboard displays live metrics and interactive charts
User analytics page shows personalized insights
Topic analytics page provides detailed breakdowns
Real-time updates appear without page refresh
Navigation flows smoothly between all sections
Integration & Performance Verification
Quiz events flow correctly from scoring engine
Analytics processing updates metrics in real-time
WebSocket broadcasts reach connected clients
AI insights integrate seamlessly with dashboard
Charts update dynamically with new data
API responses consistently under 500ms
System handles concurrent users effectively
Assignment Challenge
Extend the analytics engine to detect "learning velocity" - how quickly students master new topics. Use the aggregated performance data to identify fast learners versus those who need more support.
Implementation Steps:
Add learning velocity calculation to the analytics processor
Create a new API endpoint to serve velocity metrics
Build a dashboard component showing velocity trends
Generate insights about optimal learning paces
Bonus Challenge: Implement a simple recommendation system that suggests which topics to study next based on performance patterns and learning velocity.
This challenge prepares you for tomorrow's lesson on Topic Relationship Mapping, where we'll use these insights to build intelligent learning paths.
Production Deployment Commands
Quick Development Start:
bash
./start.sh
Production Docker Deployment:
bash
docker-compose up --build -d
System Monitoring:
Health endpoint: http://localhost:8000/health
Database monitoring:
docker logs performance-analytics-engine_postgres_1
Frontend performance: Browser DevTools Network tab
Your Performance Analytics Engine is now ready to process real quiz data and generate actionable learning insights that help students improve faster and more effectively!